The Missing Layer of O&M Systems: Visual Scans
Mark is an O&M Manager at a world-leading chemical manufacturing company. His main priority - and by extension, his teams' main priority - is to ensure their operations remain as safe and accurate as possible.
And although their systems are good, a missing layer is present.
Numerous times, Mark’s operators have struggled with executing their tasks due to confusion on where an asset is located and how to service the asset as their team changes.
This can be frustrating for Mark, as you can imagine.
And, as you can imagine, Mark isn’t alone.
Operations and Maintenance (O&M) teams have long relied on established systems to keep plants, utilities, and facilities running. From CMMS platforms to binders of SOPs, the foundation is there.
Yet, something is missing in their O&M processes. Traditional systems are capable of capturing data and methods, but they can never fully realize the visual context that workers need every day.

Why Traditional O&M Systems Fall Short
Let’s step into the shoes of a technician for a minute.
They were just assigned a corrective work order on a leaking process line. Typically, the work order Asset/Location would come across like this:
Asset: 6” Process Line – Caustic Transfer Header
Location: Unit 200, West Pipe Rack, Line No. 6C-204
Now, this description may be adequate to a technician who walks Unit 200 regularly. But for you or me, we couldn’t begin to guess where to start.
This O&M process has a missing layer: traditional O&M systems rarely show you visual context.
Scrawled pencil directions are limited, as are printed descriptions. Photos and/or PDFs only provide a single perspective. As a result, valuable time is wasted searching for equipment, orienting in the facility, and making sure the technician is in the right place.
(Imagine how much time you or I would spend looking through that West Pipe Rack…)
To be clear: this inefficiency is not intentional.
O&M systems were initially designed for data entry, not immersive navigation. And when workforce turnover is high, or institutional knowledge walks out the door, a corrective work order for Unit 200 starts to require more hand-holding from management, slower processes, and longer downtime.
The Role of Visual Scans
Imagine if that technician (or you or I) had access to a digital scan that showed exactly where the leaking process line was located.
It’s not a stretch to see how much time could be saved just looking for the asset needing servicing, let alone having digital work instructions provided and accessible.
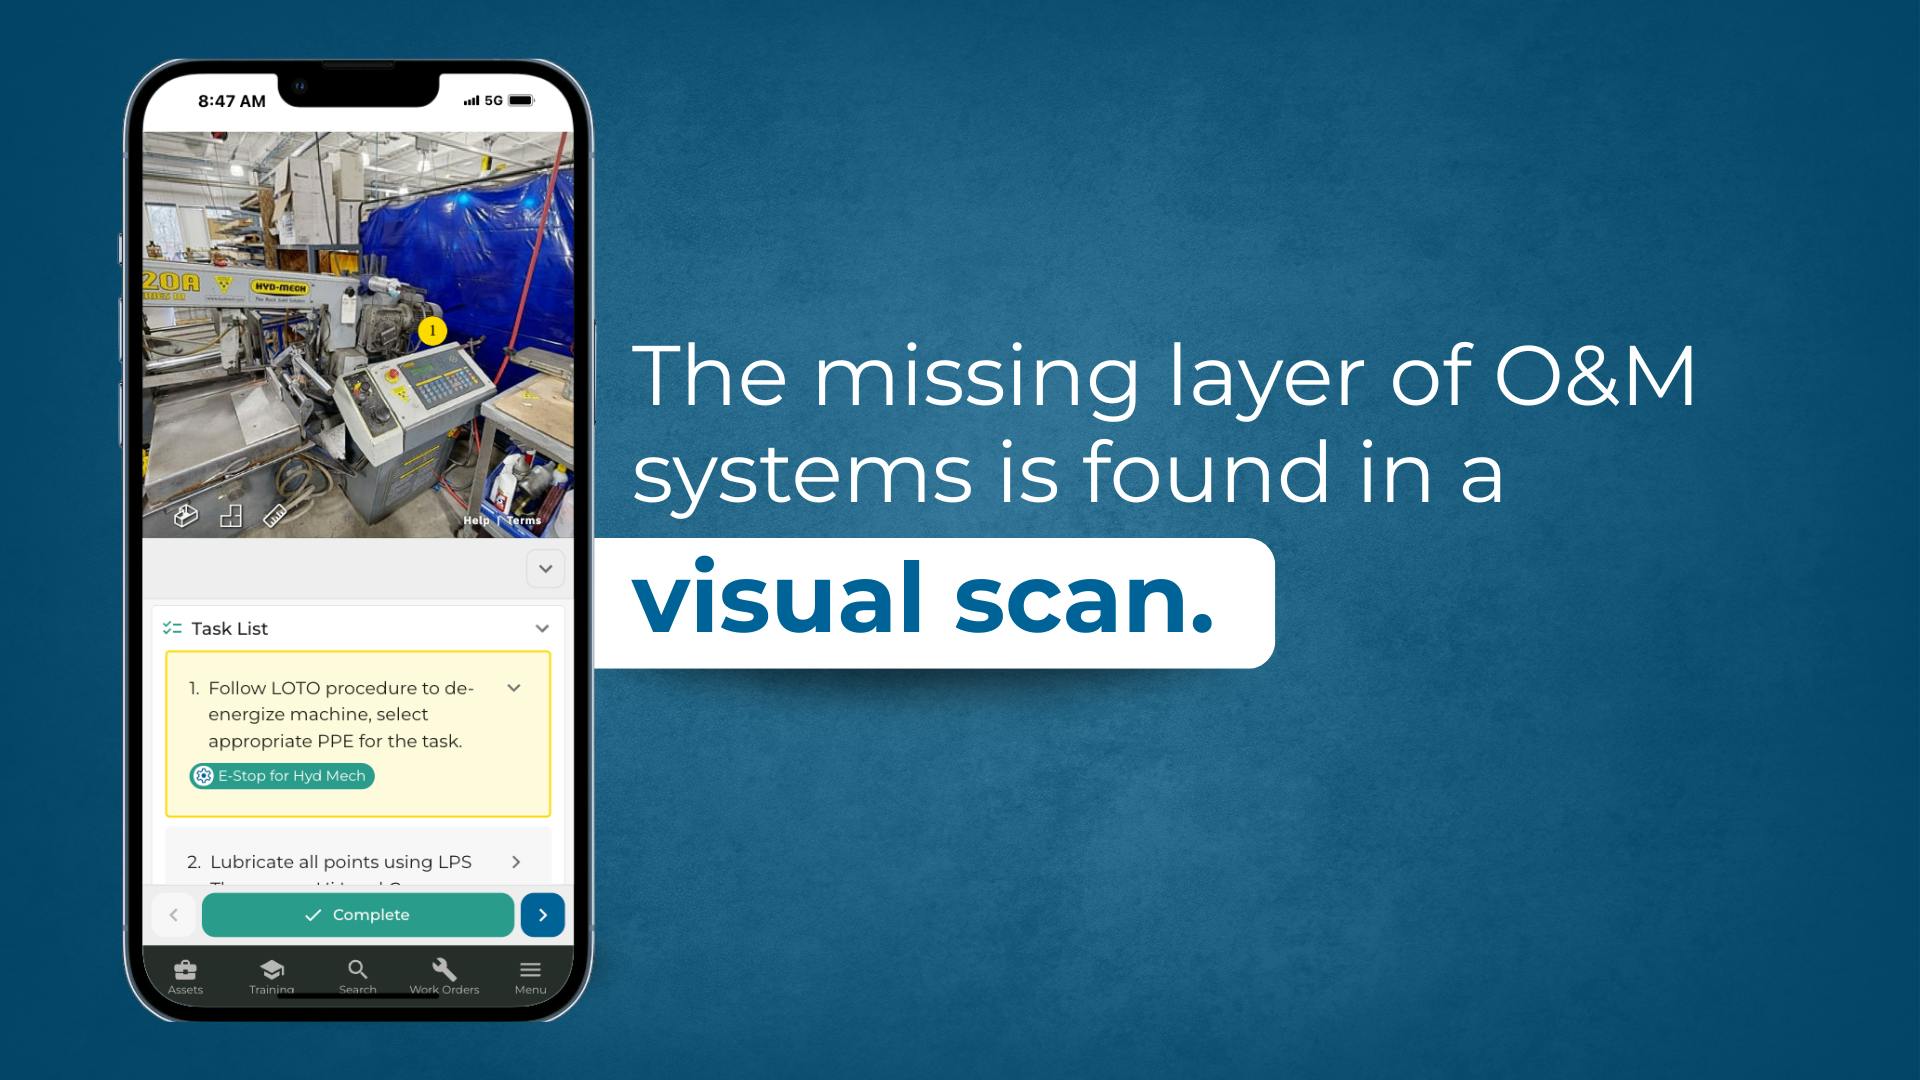
The missing layer of O&M is found in a visual scan.
Designed specifically to be a complement to existing O&M processes, a visual scan is a powerful tool for operators and technicians alike.
Instead of asking workers to recall or imagine the environment, they can step directly into a high-resolution 3D scan of their facility. And further, technicians can preview the asset in question and see the space they will be servicing before starting the task.
(Side note: previewing a site can eliminate a redundant trip up a ladder or a truck on the highway - leading to a reduction in hazardous risk. But that's a whole other use case!)
Assets are digitally stored in a 3D environment and are now more than just entries in a database. Equipment and facility layouts are now supported in a digital scan for O&M teams.
With this visual context, work orders become actionable, training becomes site-specific, and knowledge transfer becomes intuitive. To be sure, the scan doesn’t replace a CMMS or SOP libraries (though it can), but rather complements O&M procedures by grounding tasks and data in the real-world environment.
Real Benefits for O&M Teams
Using visual scans to complement O&M tasks has tangible benefits. For maintenance leaders like Mark, there’s a measurable impact beyond a better user experience for their operators.
- Faster mean time to repair (MTTR): Technicians navigate directly to assets instead of hunting them down. A client recently shared that we cut asset location finding times from 10 minutes to 12 seconds.
- Reduced downtime: Knowing exactly where equipment is located shortens service windows, leading to faster resolution and more competent task completion. Some of our clients are reporting a 25%+ reduction in downtime.)
- Stronger compliance: Safety procedures can be visualized and reinforced within the scan. And like previously mentioned, some hazardous risks can be reduced or eliminated entirely with using a visual scan for previewing and planning.
- Fewer errors: Clear, site-specific guidance cuts out guesswork and rework, preserving dollars, hours, and peace of mind. The math is simple: less errors = better margins.
Aetos is realizing a lot of these benefits for our users. Our digital scans are complementing O&M teams in significant, measurable ways. Partners report ROI metrics like 25% downtime reduction, 50% faster onboarding, and 20% fewer mistakes in safety procedures when visual context complements existing O&M systems.

The Future of O&M Is Visual
The missing layer of O&M has been found. By using visual scans as a complement to daily tasks, every corner of a plant, facility, and piece of equipment can be visualized.
These digital scans make data actionable for the workforce, and connects them to their processes like never before.
Aetos helps technicians interpret work orders, SOPs, and other tasks necessary for the safe functions of an organization. Better support, clearer instructions, and empowered operators – all possible with visual context.
So when Mark assigns either of us to fix that leak on that West Pipe Rack, we can get right to it: the right work, at the right spot, without wasted steps.